abc MICROSOFT EXCEL 2010 - Functions
Counting the selected values COUNTIF/ - Average values
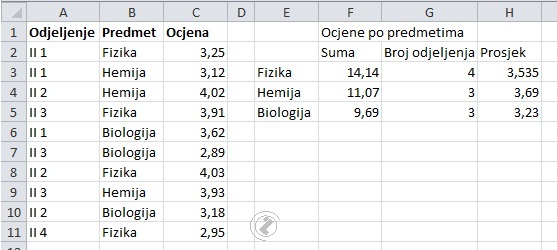
Students of the classes achieved certain accomplishments in given subjects. Calculate the number of classes by individual subjects, look at the next animation, and for summing the selected subjects (animation >>.) and averaging the values (animation >>).
|
|
|
||||||||||||||||||||||||||||||||||||||||||||||||||||||||||||||||||||||||||||||||||||||||||||||||
|
Picture 1. Results by subject |
Picture 2. Summing the selected /FUNCTION SUMIF/ |
 |
Counting the selected values /FUNCTION COUNTIF/ - Average values, steps:
|


